 Catalogue PIGMA
/Etat du Milieu/Espèces
Type of resources
Available actions
Topics
Keywords
Contact for the resource
Provided by
Years
Formats
Representation types
Update frequencies
status
Service types
Scale
Resolution
-
Mediterranean and Black Sea fisheries feature a great variety of target species, vessels and fishing gears and play an important socioeconomic role in the whole region. The mandate of the General Fisheries Commission for the Mediterranean (GFCM) is to ensure the sustainability of fisheries activities through the adoption of adequate management measures. The assessment of the size and state of the stocks exploited by fisheries is one of the pillars of modern management. The GFCM as the responsible Regional Fisheries Management Organisations (RFMO) of the Mediterranean and Black Sea has established permanent working groups on dermersal and small pelagic fish species where fisheries scientists perform their analysis and provide the best scientific advice to better manage fisheries and fish stocks. The groups, in cooperation with regional programs under the Regional Sea Conventions, set standards and guidelines for the collection, transmission and analysis of these data.
-
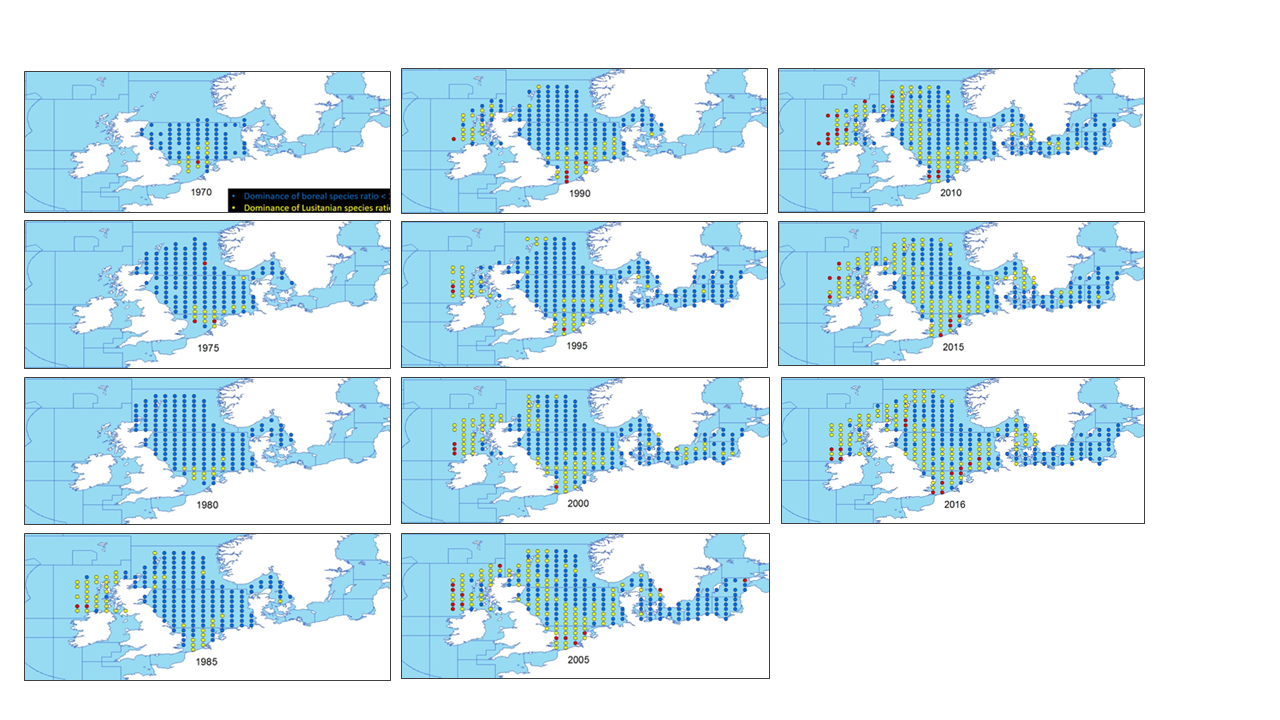
This metadata describes the ICES data on the temporal development of the Lusitanina/Boreal species ratio in the periode from 1965 to 2016. Key message: The ratio between the number of Lusitanian (warm-favouring) and Boreal (cool-favouring) species are significantly increasing in 6 of the Northern division whereas there is no significant changes in all the (Southern) other divisions. Blue dots indicates L/A ratios below 1 Yellow dots indicates L/B ratios >=1 and <2 Red dots indicates L/B ratios >=2 The dataset is derived from the ICES data portal 'DATRAS' (the Database of Trawl Surweys). DATRAS is an online database of trawl surveys with access to standard data products. DATRAS stores data collected primarily from bottom trawl fish surveys coordinated by ICES expert groups. The survey data are covering the Baltic Sea, Skagerrak, Kattegat, North Sea, English Channel, Celtic Sea, Irish Sea, Bay of Biscay and the eastern Atlantic from the Shetlands to Gibraltar. At present, there are more than 45 years of continuous time series data in DATRAS, and survey data are continuously updated by national institutions. The dataset has been used in the EEA Indicator "Changes in fish distribution in European seas" https://www.eea.europa.eu/data-and-maps/indicators/fish-distribution-shifts/assessment-1. The dataset has been used for this static map: https://www.eea.europa.eu/data-and-maps/figures/temporal-development-of-the-lusitanina included in the "Marine messages II - Navigating the course towards clean, healthy and productive seas through implementation of an ecosystem‑based approach" (EEA Report No 17/2019) https://www.eea.europa.eu/publications/marine-messages-2
-
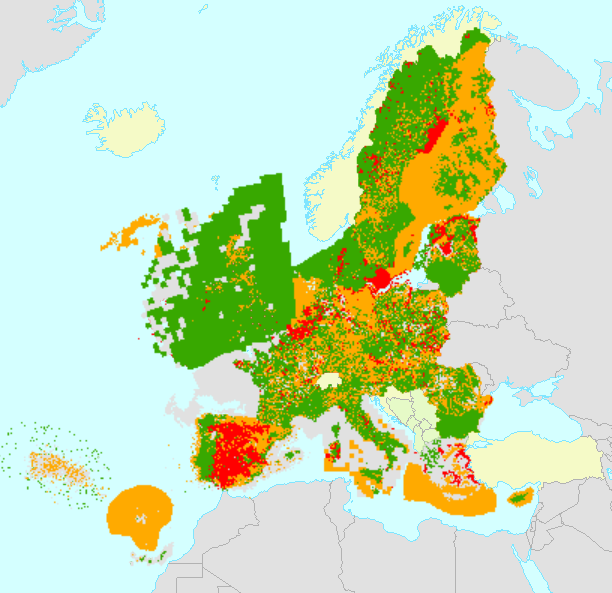
Gridded Distribution of Species as reported during the Article 17 of the Habitats Directive (92/43/EEC) covering the period 2001 to 2006. The data covers the EU 25. All Member States are requested by the Habitats Directive (92/43/EEC) to monitor habitat types and species considered to be of Community interest. Article 17 of the Habitats Directive 92/43/EEC requires that every 6 years Member States prepare reports to be sent to the European Commission on the implementation of the Directive. The Article 17 report for the period 2001-2006 for the first time includes assessments on the conservation status of the habitat types and species of Community interest. Information on the data quality of the 2001-2006 reporting round is available at http://bd.eionet.europa.eu/article17.
-
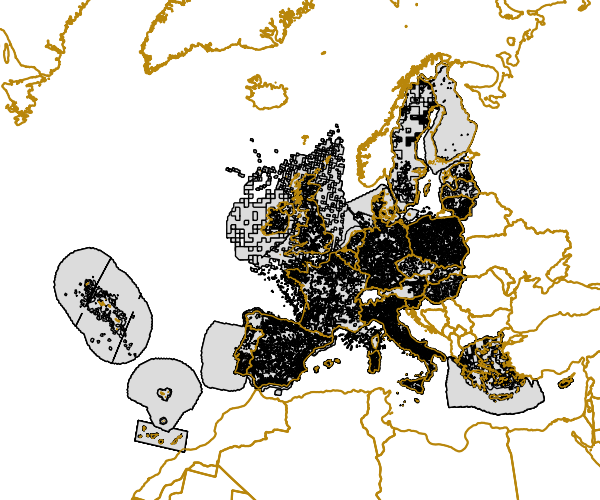
The dataset represents the introduction of non-indigenous species in European seas. Non-indigenous species are species that have been spread as a result of human activities to areas where they do not belong naturally. The main concern are the invasive species, which are defined as causing a significant negative impact on biodiversity as well as serious economic and social consequences. The dataset has been prepared first by individually mapping each aquatic invasive species that had a distinctive distribution area, which had been provided by several non-indigenous species online databases. The distribution of the species were then resampled into the EEA 10 km grid and summed together, showing the number of non-indigenous species per grid cell. The temporal reference of the dataset covers the last 30 years (1989 - 2018). This dataset has been prepared for the calculation of the combined effect index, produced for the ETC/ICM Report 4/2019 "Multiple pressures and their combined effects in Europe's seas" available on: https://www.eionet.europa.eu/etcs/etc-icm/etc-icm-report-4-2019-multiple-pressures-and-their-combined-effects-in-europes-seas-1.
-
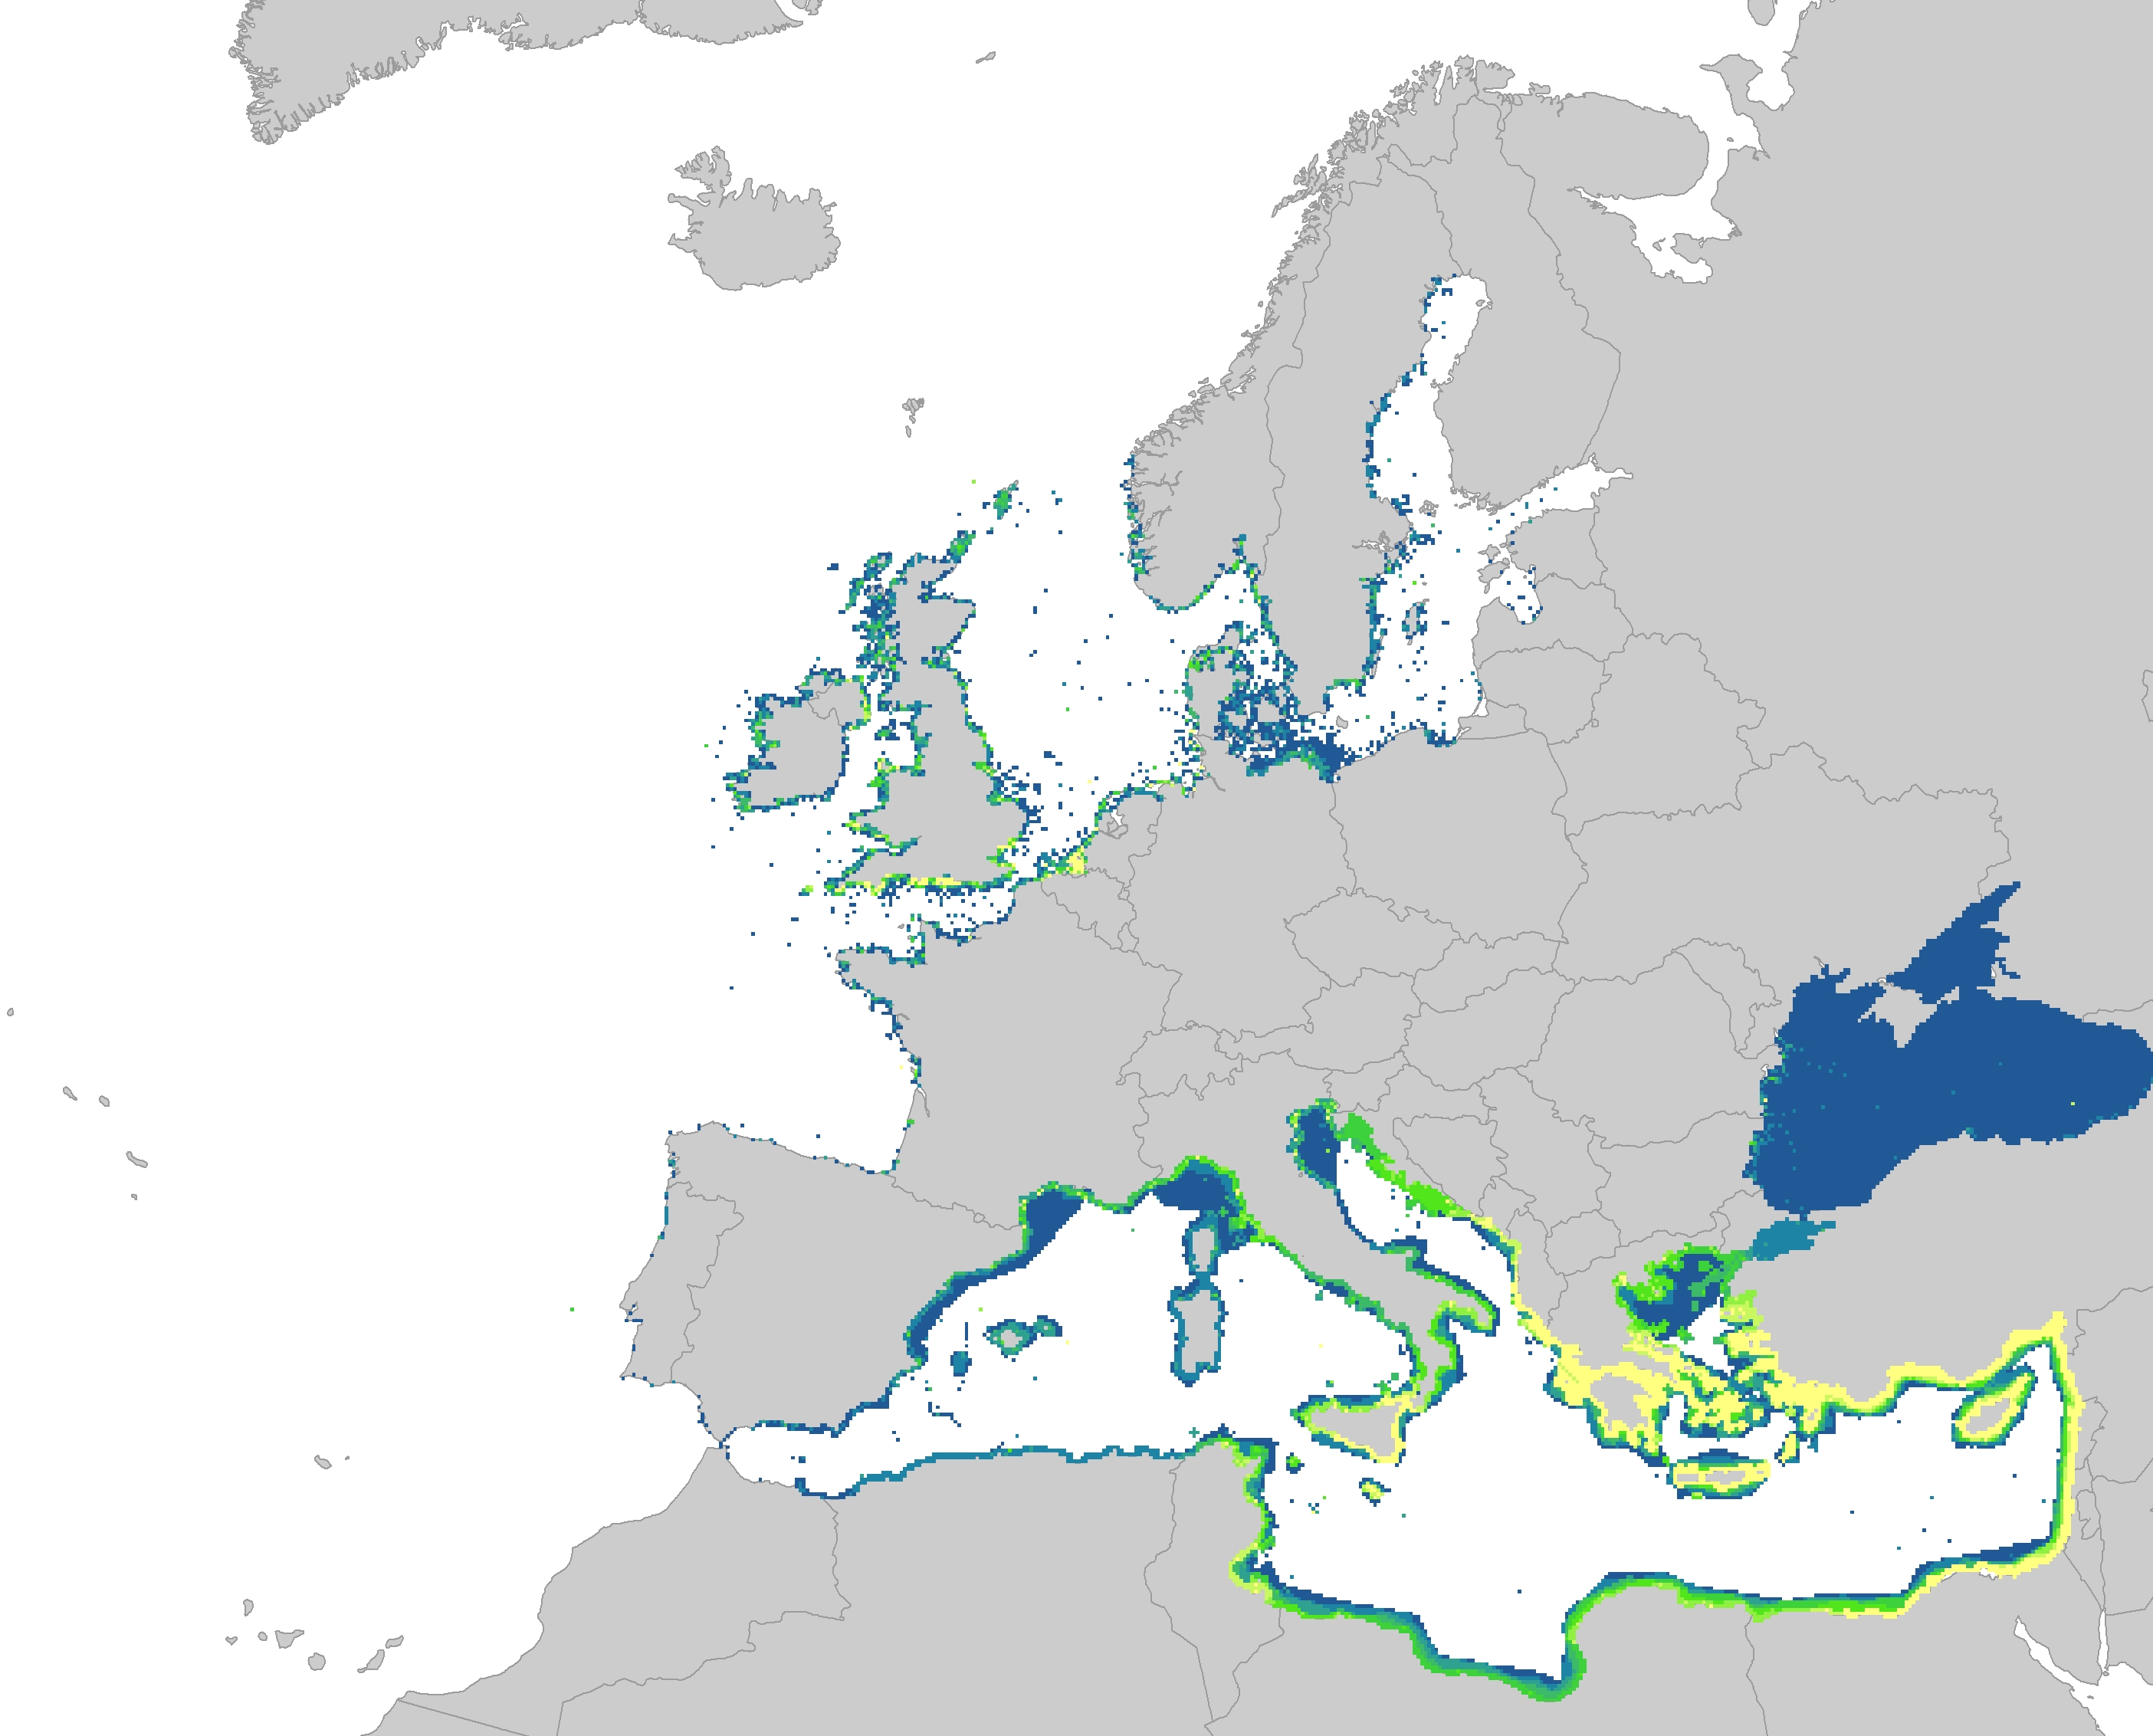
This raster dataset represents the probability of occurrence of whales in the Europe Seas, where the species included are: Blue whale, Sei whale, Humpback whale, Sperm whale, Fin whale and Northern right whale. The northern right whale model only describes the range of the western population of this species, since the eastern population is probably almost extinct. Thus, the northern right whale model only partly overlaps with the EEA area on interest. This dataset is based on AquaMaps distribution maps (version 10/2019). The dataset has been prepared in the context of the development of the first European Maritime Transport Environmental Report (EMSA-EEA report, 2021: https://www.eea.europa.eu/publications/maritime-transport).
-
All Member States are requested by the Habitats Directive (92/43/EEC) to monitor habitat types and species listed in its annexes and send a report every 6 years following an agreed format. The assessment of conservation status is based on information about the status and trends of species populations and of habitats at the level of the biogeographical or marine region. The spatial dataset contains habitat and species distribution data (10km grid cells) as reported by EU 27 (2007-2013) Member States for the 2007-2012 period. This metadata refers to the public dataset, without sensitive species. The data sets are divided in two sets for species and two sets for habitat types. Habitats: Art17_habitats_distribution_2007_2012_EU (distribution by European Union aggregate) Art17_habitats_distribution_2007_2012_MS (distribution by Member State) Species: Art17_species_distribution_2007_2012_EU (distribution by European Union aggregate) Art17_species_distribution_2007_2012_MS (distribution by Member State) Furthermore, a series of tables are also provided with the assessments of conservation status of species and habitats at Member State biogeographical level (done by Member States) and at EU biogeographical level (done by the ETC/BD and the EEA). Both MS datasets are aggregated by habitat/species code, country and biogeographical /marine region [COMSRE]. Using this attribute [COMSRE] the tabular conservation status, which is available in the table, per biogeographical/marine region of the Member State level (MS) can be joined directly to the spatial dataset. Both EU datasets are aggregated by habitat/species code and biogeographical /marine region [CORE]. Using this attribute [CORE] the tabular conservation status, which is available in the table, of the biogeographical/marine region of the EU-27 (2007-2013) level (EU) can be directly joined to the spatial dataset. NOTE: The original datasets have been reviewed and re-published in February 2021, including delayed deliveries from Greece.
-
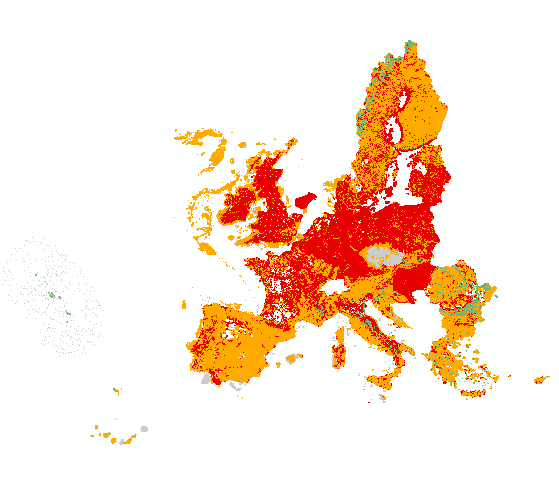
All Member States are requested by the Habitats Directive (92/43/EEC) to monitor habitat types and species listed in its annexes and send a report every 6 years following an agreed format. The assessment of conservation status is based on information about the status and trends of species populations and of habitats at the level of the biogeographical or marine region. The spatial dataset contains habitat and species distribution data (10km grid cells) as reported by Member States for the 2013-2018 period. This metadata refers to the public dataset, without sensitive species. The data sets are divided in two sets for species and two sets for habitat types. Species: ART17 species distribution MS (by Member State) ART17 species distribution EU (European Union aggregate) Habitats: ART17 habitats distribution MS (by Member State) ART17 habitats distribution EU (European Union aggregate) Both MS datasets are aggregated by habitat/species code, country and biogeographical /marine region [CO_MS_RE]. Using this attribute [CO_MS_RE] the tabular conservation status, which is available in the table, per biogeographical/marine region of the Member State level (MS) can be joined directly to the spatial dataset. Both EU datasets are aggregated by habitat/species code and biogeographical /marine region [CO_RE]. Using this attribute [CO_RE] the tabular conservation status, which is available in the table, of the biogeographical/marine region of the EU-28 level (EU) can be directly joined to the spatial dataset. Further description of the Article 17 tabular and spatial dataset and a Article 17 web tool can be accessed with the download data.
-

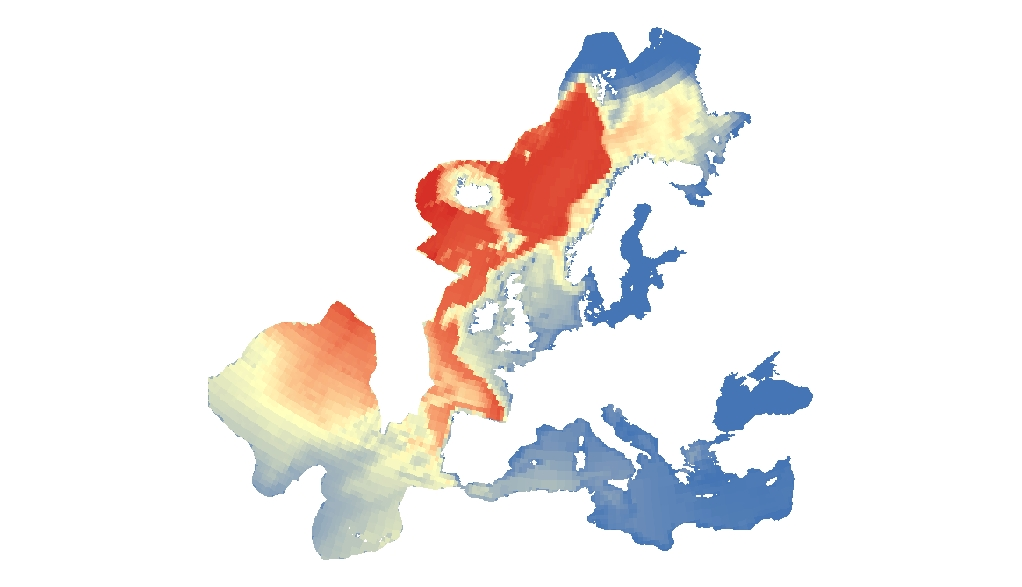
The raster dataset represents the risk of collision of whales with vessels in Europe Seas. The most vulnerable species from ship strikes are cetaceans and turtles, since they go to the surface to breathe. On the other hand, their migration routes can overlap with shipping lanes. The collisions can produce the death or injury of the animals, and are an important threat for the conservation of these species. The dataset has been prepared in the context of the development of the first European Maritime Transport Environmental Report (EMSA-EEA report, 2021: https://www.eea.europa.eu/publications/maritime-transport).
-
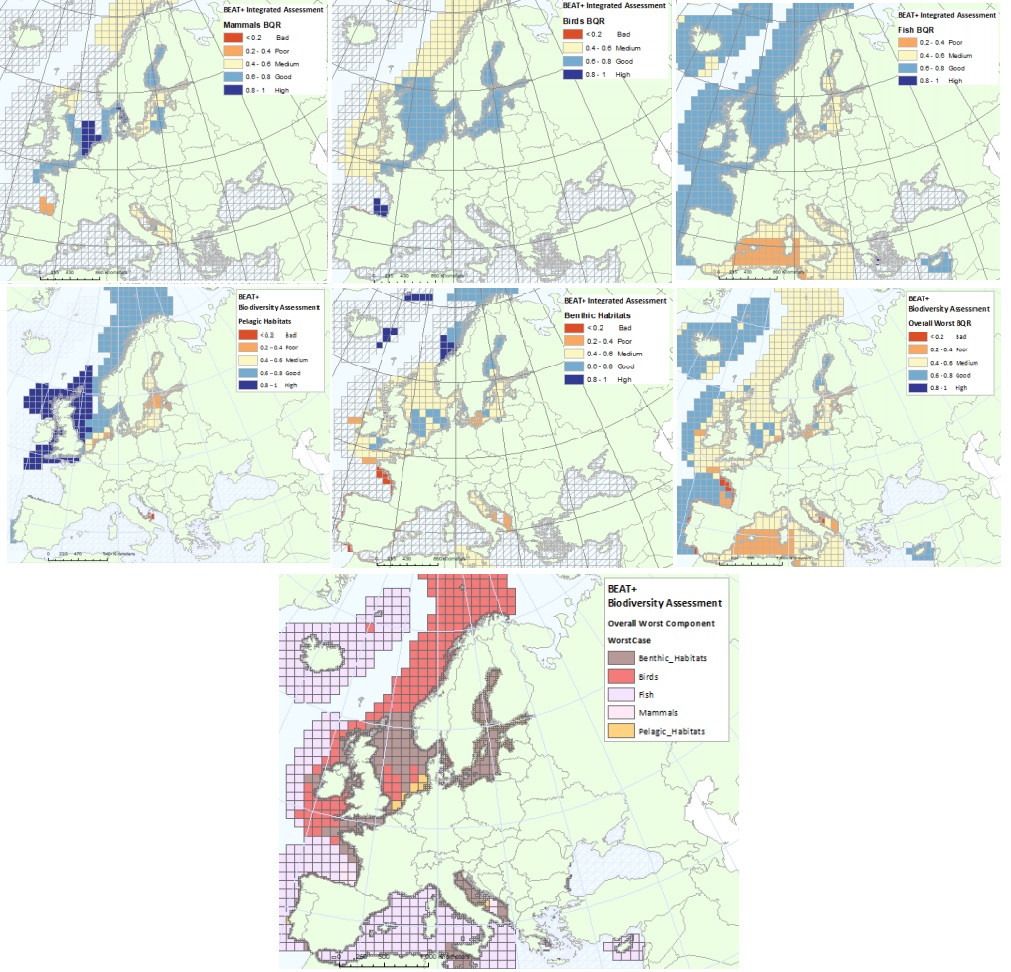
The BEAT+ tool builds on the EEA assessment tools developed and applied in the context of assessing the degree of contamination (CHASE+), eutrophication (HEAT+) and biodiversity (BEAT+) in Europe's seas. BEAT+ makes use of the same data sets and threshold values used in these assessments but recombines these in a new framework that addresses 'biodiversity condition'. BEAT+ has been designed to provide an assessment of the spatial variability of a range of biodiversity components by combining existing biodiversity indicators. The tool integrates data from normalised indicators to identify worst case status measures for different biodiversity components. The results are then linked to a standard gridE based Spatial Assessment Unit (SAU) which is used both for biodiversity and for pressures assessments (Andersen et al., 2014). These grid-based SAUs not only allow alignment of indicators for biodiversity and for pressures but provide a means for combining large assessment areas (e.g. for wide‐ranging species) with point data collected from biological surveys e.g. WFD monitoring. BEAT+ tool works by calculating a Biological Quality Ratio (BQR) which is an aggregated score of indicator outcomes within a grid square. To allow objective comparison, the indicator outcomes are normalised to a scale of 0 to 1, with five status classes at equal intervals on that scale (from Bad starting at 0, Poor at 0.2, Medium at 0.4, Good at 0.6 and High at 0.8). By this means, indicators based on different biological criteria can be aggregated in a consistent way. This metadata refers to dataset providing the results of classification of biodiversity status using the BEAT+ tool. The status is evaluated in five classes, where High and Good are recognised as ‘non-problem areas’ and Moderate, Poor and Bad are recognised as ‘problem areas’. The dataset covers: - BQR Assessment of all marine mammals combined (mainly focused on coastal and relatively stable inshore populations of seals, dolphins and porpoises) - BQR Assessment of seabirds and wading birds - BQR Assessment of commercial fish (as these have agreed targets defined on biomass and fishing mortality) - BQR Assessment of pelagic habitats - BQR Assessment of benthic habitats - BQR Assessment of worst-performing biodiversity groups - An overall synthesis of the Biological Quality Ratios (BQR) values (showing which are the worst -lowest- BQR values in each assessment grid cell. The ‘worst’ value is used here to identify the biological group most at risk, rather than averaging over all groups to avoid over-emphasis on groups with more intensive monitoring). As reference, please consult the ETC/ICM Report 3/2019: Biodiversity in Europe's seas: https://www.eionet.europa.eu/etcs/etc-icm/products/biodiversity-in-europes-seas. The indicator BEAT+ Integrated Assessment Worst Case BQR has been used in the EEA report 17/2019 "Marine Messages II": https://www.eea.europa.eu/publications/marine-messages-2.
-
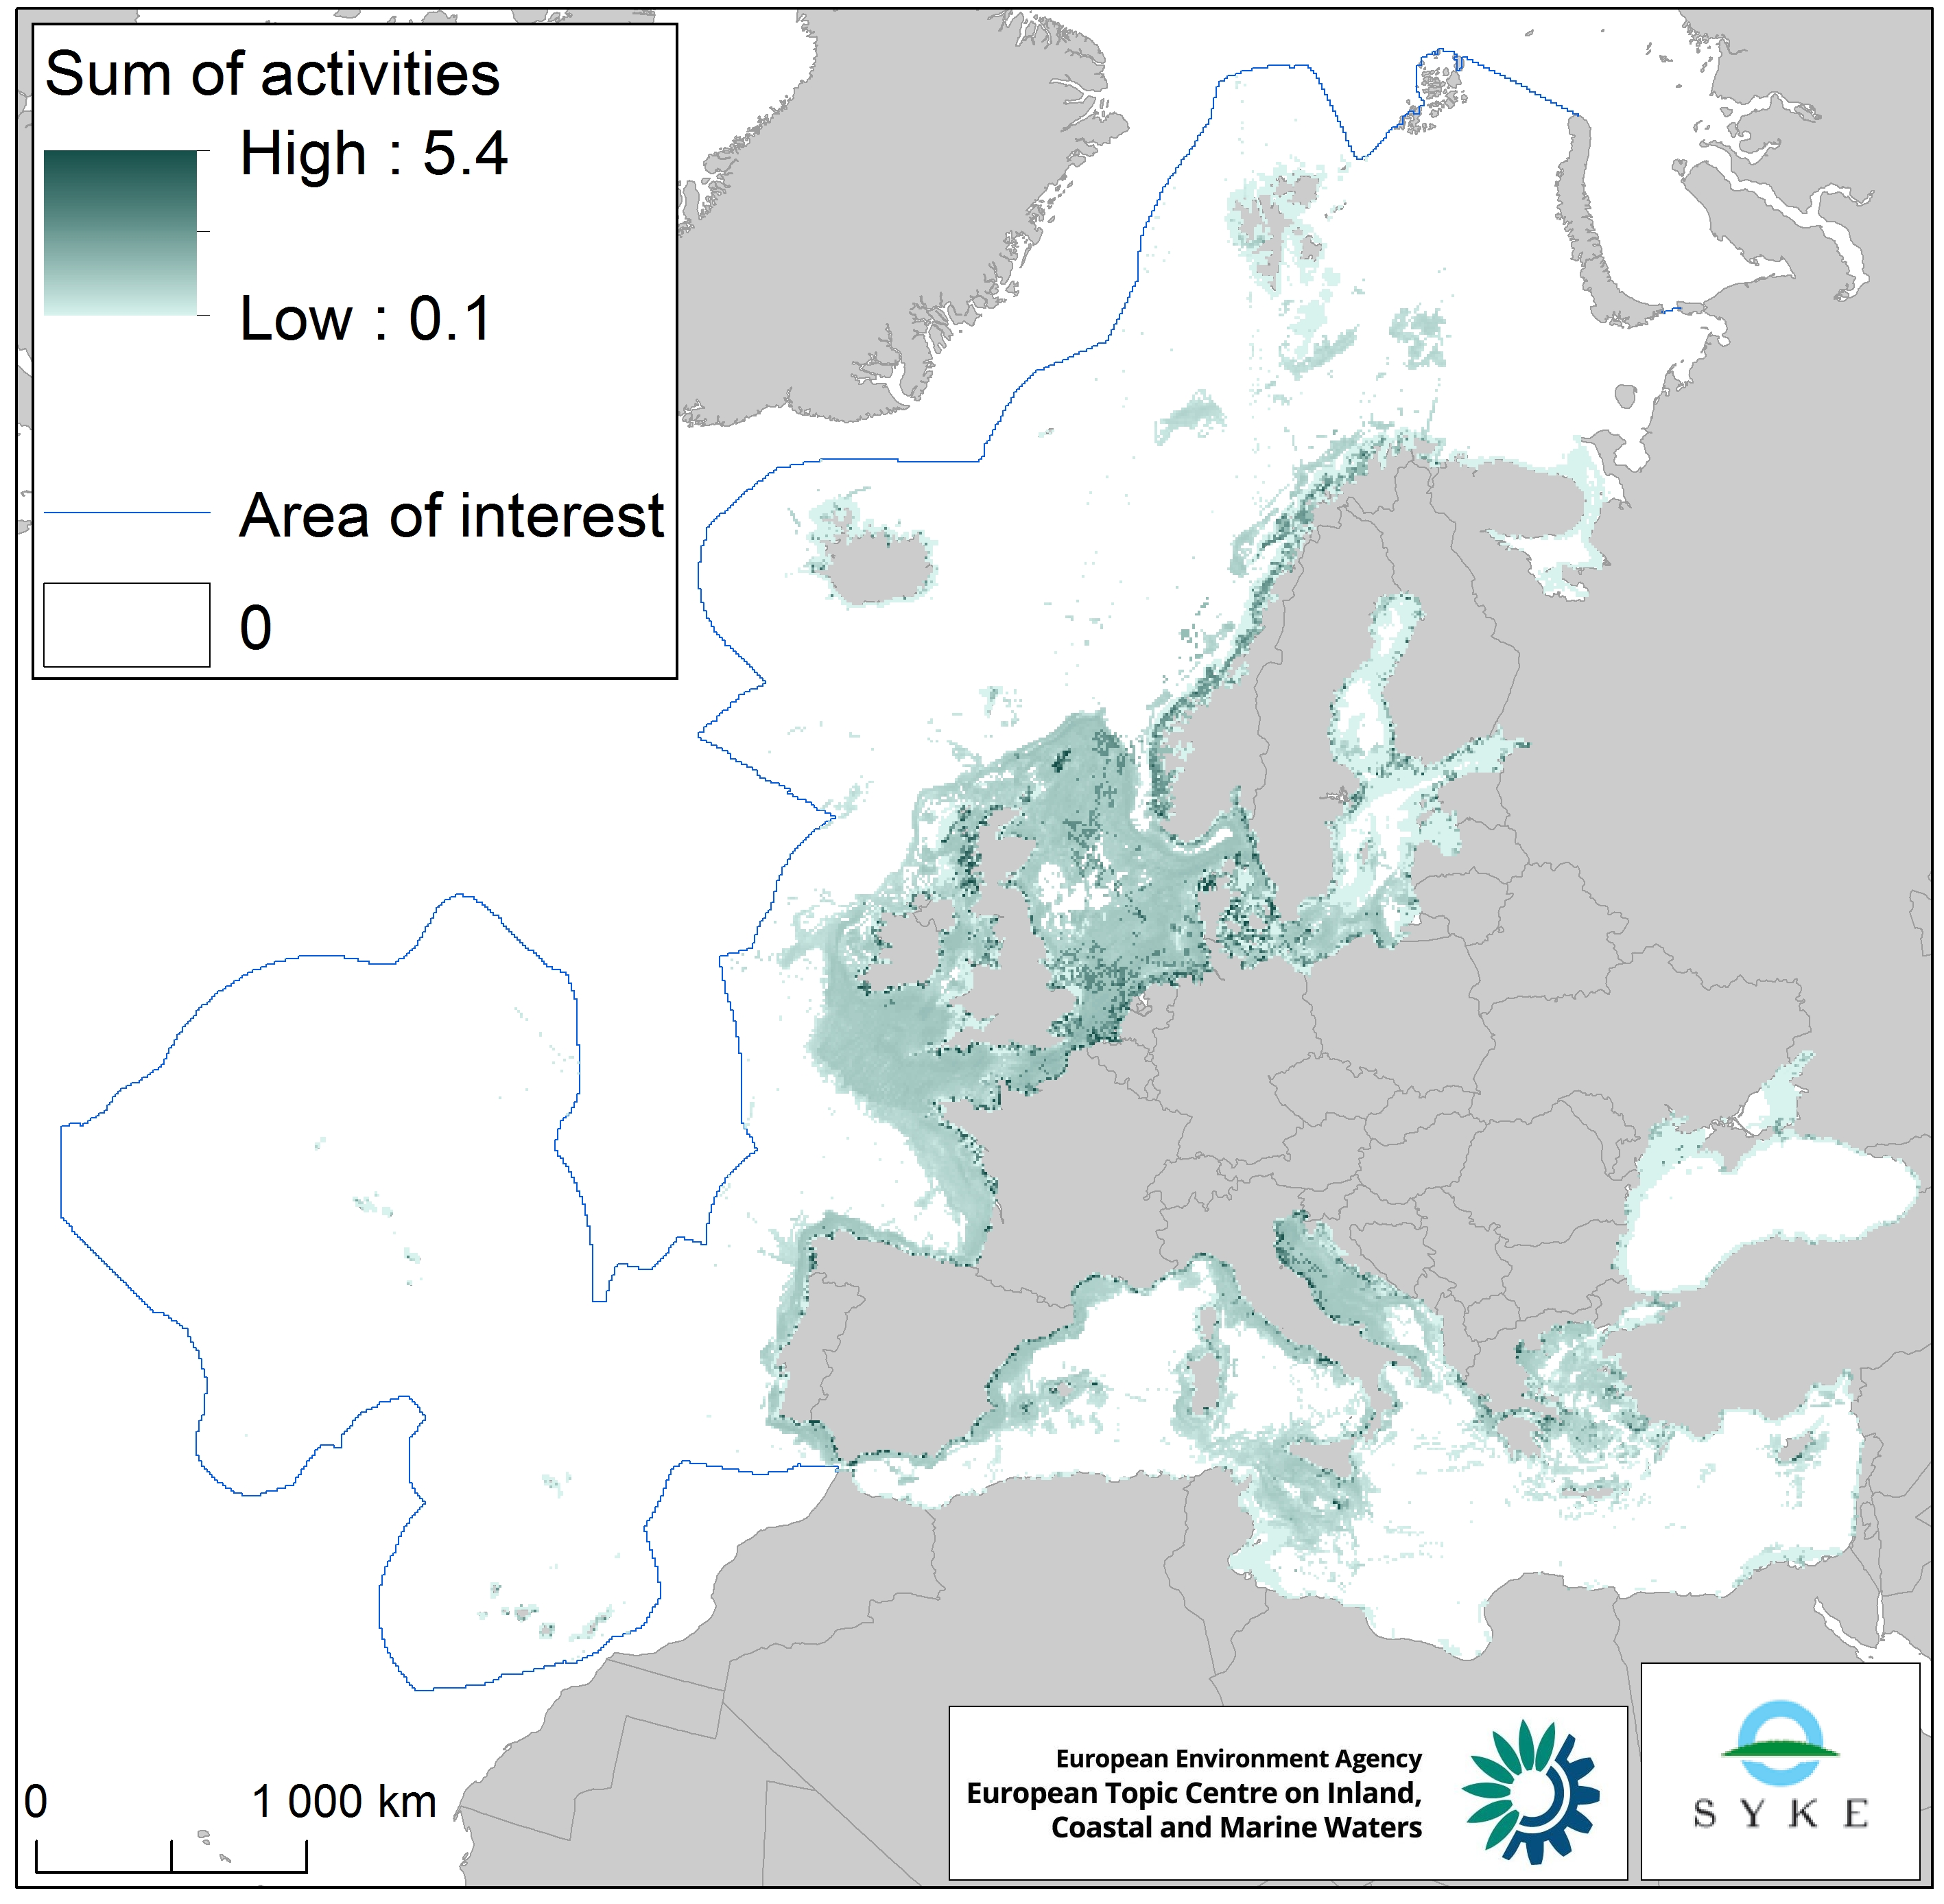
This raster dataset represents physical disturbance to the seabed in the European seas. Several human activities disturb the seabed either directly or indirectly. Alteration of benthic living conditions as a result of increased sedimentation or attenuation of light penetration, abrasion of the seabed and exploitation of benthic biota, temporarily disturb the benthic habitat quality. The dataset is an aggregation of several different human activities that cause physical disturbance to the seabed: aquaculture, demersal fishing, dredging and dumping of dredged material, oil and gas rigs, offshore installations, ports, sand and gravel extraction, shellfish mariculture, shipping in shallow waters and windfarms. The resulting dataset is a raster (10km grid cell) derived from EMODnet, MED-IAMER, JRC-STECF, OSPAR, HELCOM and 4C Offshore datasets, and with reference temporal coverage from 2012 to 2017. This dataset has been prepared for the calculation of the combined effect index, produced for the ETC/ICM Report 4/2019 "Multiple pressures and their combined effects in Europe's seas" available on: https://www.eionet.europa.eu/etcs/etc-icm/etc-icm-report-4-2019-multiple-pressures-and-their-combined-effects-in-europes-seas-1.